Animating RNA velocity with moving arrows
In my previous blog post, I discussed how we can use animations to enhance our data visualizations and tell stories about our data. Here, I wanted to use animation to potentially further enhance the visualizations of cellular trajectories.
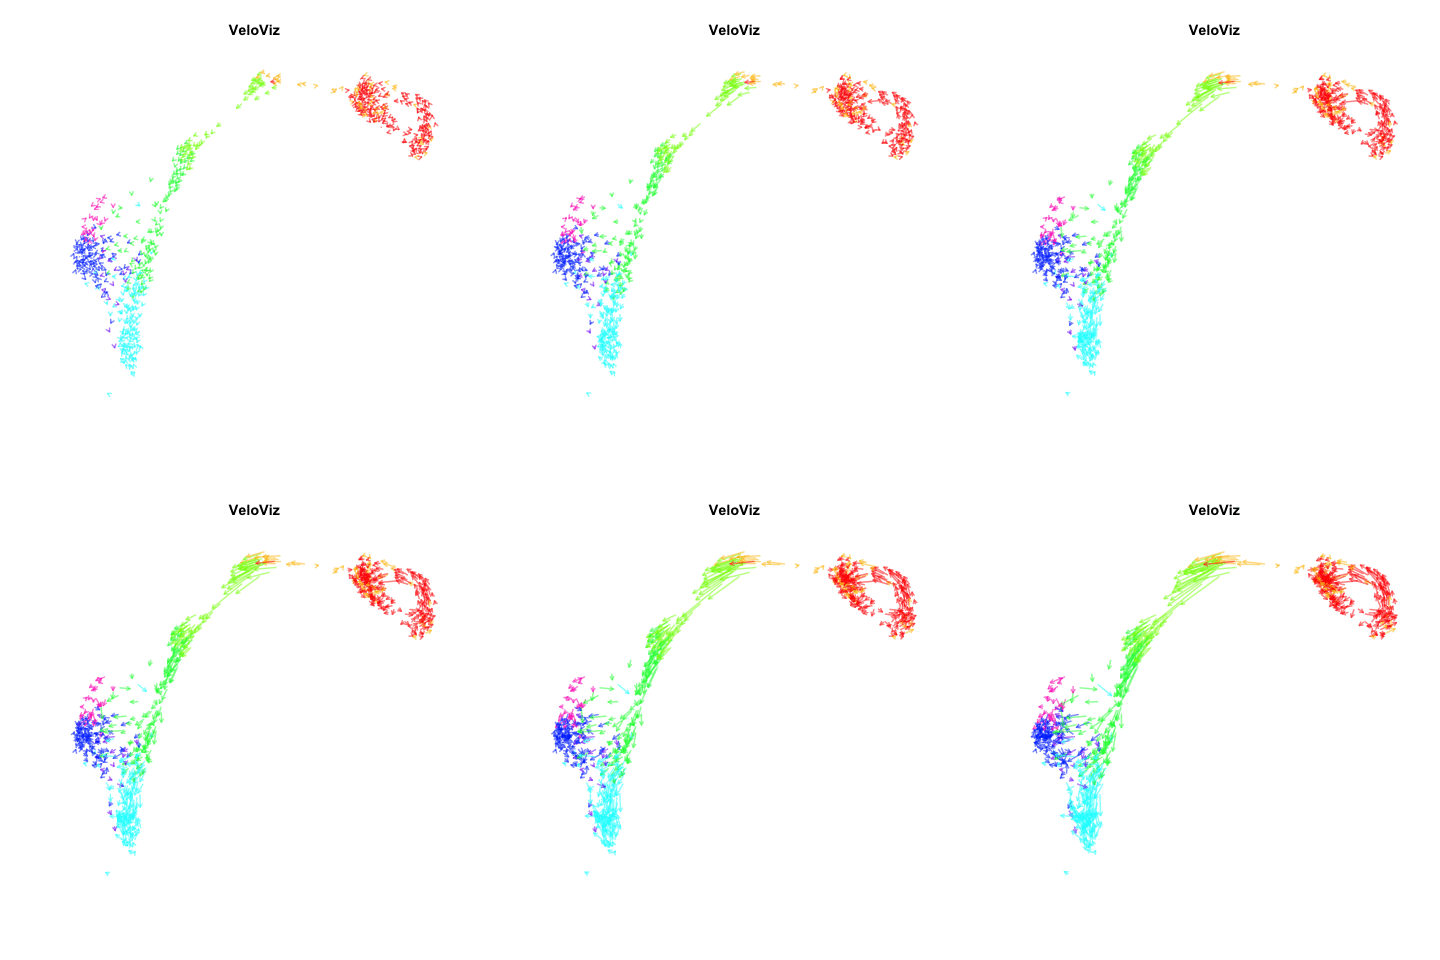
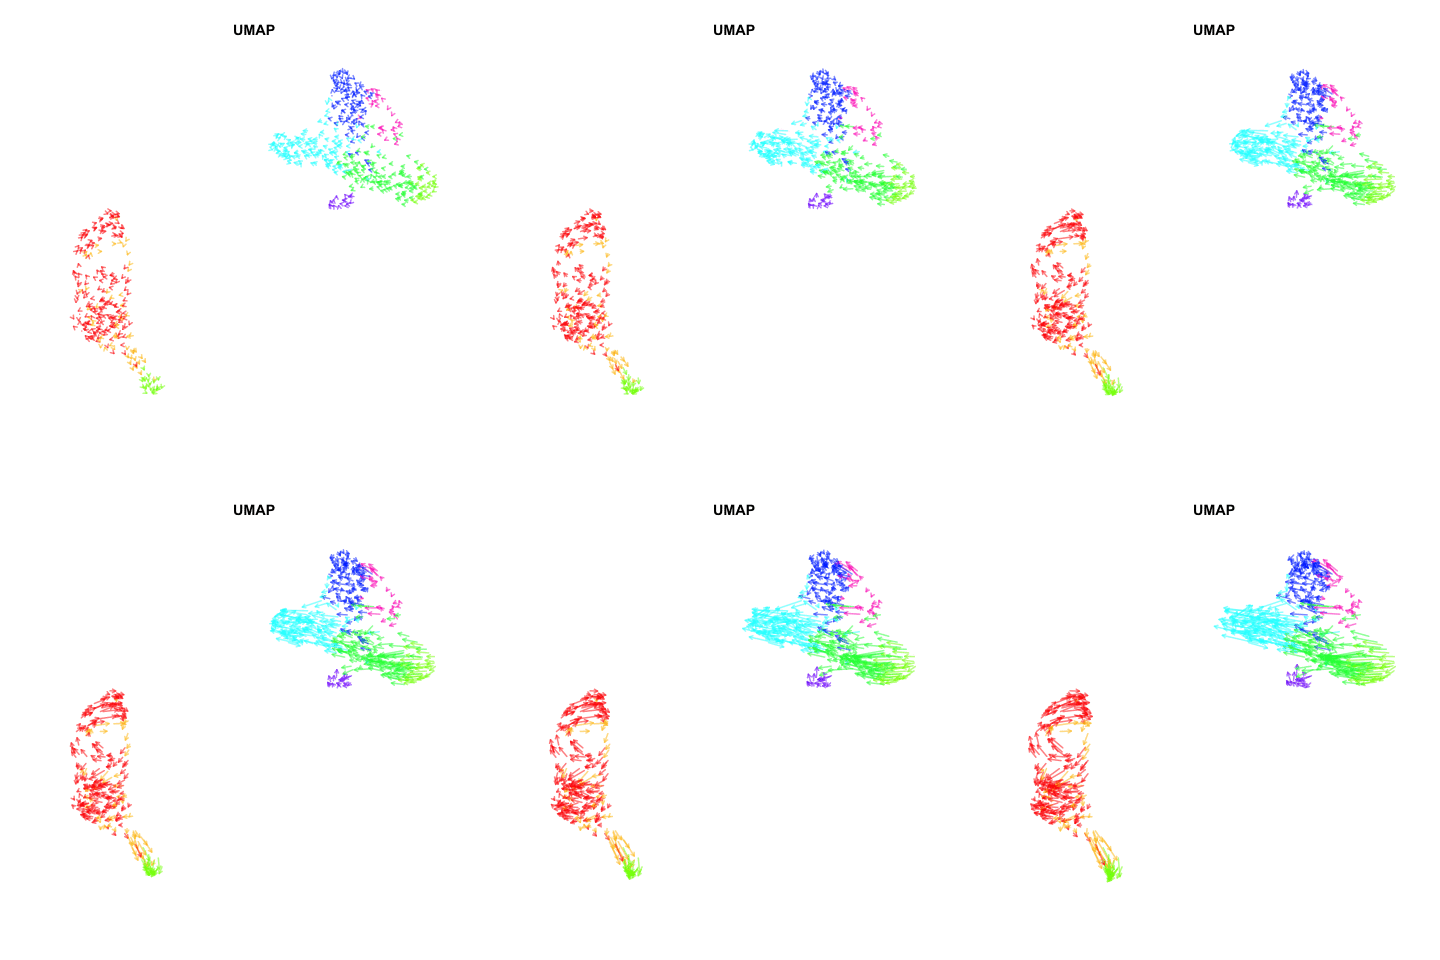
Recently, my lab published a method called VeloViz in Oxford Bioinformatics that integrates information regarding each cell’s predicted future transcriptional state inferred from RNA velocity analysis to create 2D and 3D embeddings of single cell transcriptomics data to visualize cellular trajectories. In our paper, we show how by taking into account the predicted future transcriptional states of cells from RNA velocity analysis, VeloViz can help visualize a more reliable representation of underlying cellular trajectories even when intermediate cell states may be missing. Following the VeloViz analysis tutorial for visualizing cellular trajectories, I obtained the 2D embedding of a pancreas endocrinogenesis dataset with missing intermediate cell states using UMAP and VeloViz.
I then changed a few lines of code in the show.velocity.on.embedding.cor() function of the velocyto.R package to allow me to represent each cell as a colored arrow (where color represents the cell’s cell-type in this case) going from its observed transcriptional state to its projected predicted future transcriptional state inferred from RNA velocity analysis. I then used the animation package to animate the arrows.
Perhaps some additional opacity tinkering, size of arrow heads, or other features could be helpful. Try it out for yourself and see what you think!
show.velocity.on.embedding.cor2 <- function (emb, vel, n = 100, cell.colors = NULL, corr.sigma = 0.05,
          show.grid.flow = FALSE, grid.n = 20, grid.sd = NULL, min.grid.cell.mass = 1,
          min.arrow.size = NULL, arrow.scale = 1, max.grid.arrow.length = NULL,
          fixed.arrow.length = FALSE, plot.grid.points = FALSE, scale = "log",
          nPcs = NA, arrow.lwd = 1, arrow.alpha = 0.5, xlab = "", ylab = "", n.cores = velocyto.R:::defaultNCores(),
          do.par = T, show.cell = NULL, cell.border.alpha = 0.3, cc = NULL,
          return.details = FALSE, expression.scaling = FALSE, ...)
{
  randomize <- FALSE
  if (do.par)
    par(mfrow = c(1, 1), mar = c(3.5, 3.5, 2.5, 1.5), mgp = c(2,
                                                              0.65, 0), cex = 0.85)
  celcol <- "white"
  if (is.null(show.cell)) {
    celcol <- cell.colors[rownames(emb)]
  }
  plot(emb, bg = celcol, pch = 21, col = ac(1, alpha = cell.border.alpha),
       xlab = xlab, ylab = ylab, ...)
  em <- as.matrix(vel$current)
  ccells <- intersect(rownames(emb), colnames(em))
  em <- em[, ccells]
  emb <- emb[ccells, ]
  nd <- as.matrix(vel$deltaE[, ccells])
  cgenes <- intersect(rownames(em), rownames(nd))
  nd <- nd[cgenes, ]
  em <- em[cgenes, ]
  if (randomize) {
    nd <- t(apply(nd, 1, function(x) (rbinom(length(x), 1,
                                             0.5) * 2 - 1) * abs(sample(x))))
  }
  if (is.null(cc)) {
    cat("delta projections ... ")
    if (scale == "log") {
      cat("log ")
      cc <- velocyto.R:::colDeltaCorLog10(em, (log10(abs(nd) + 1) *
                                    sign(nd)), nthreads = n.cores)
    }
    else if (scale == "sqrt") {
      cat("sqrt ")
      cc <- velocyto.R:::colDeltaCorSqrt(em, (sqrt(abs(nd)) * sign(nd)),
                            nthreads = n.cores)
    }
    else if (scale == "rank") {
      cat("rank ")
      cc <- velocyto.R:::colDeltaCor((apply(em, 2, rank)), (apply(nd,
                                                     2, rank)), nthreads = n.cores)
    }
    else {
      cat("linear ")
      cc <- velocyto.R:::colDeltaCor(em, nd, nthreads = n.cores)
    }
    colnames(cc) <- rownames(cc) <- colnames(em)
    diag(cc) <- 0
  }
  cat("knn ... ")
  if (n > nrow(cc)) {
    n <- nrow(cc)
  }
  emb.knn <- velocyto.R:::balancedKNN(t(emb), k = n, maxl = nrow(emb), dist = "euclidean",
                         n.threads = n.cores)
  diag(emb.knn) <- 1
  cat("transition probs ... ")
  tp <- exp(cc/corr.sigma) * emb.knn
  tp <- t(t(tp)/Matrix::colSums(tp))
  tp <- as(tp, "dgCMatrix")
  cat("done\n")
  if (!is.null(show.cell)) {
    i <- match(show.cell, rownames(emb))
    if (is.na(i))
      stop(paste("specified cell", i, "is not in the embedding"))
    points(emb, pch = 19, col = ac(val2col(tp[rownames(emb),
                                              show.cell], gradient.range.quantile = 1), alpha = 0.5))
    points(emb[show.cell, 1], emb[show.cell, 2], pch = 3,
           cex = 1, col = 1)
    di <- t(t(emb) - emb[i, ])
    di <- di/sqrt(Matrix::rowSums(di^2)) * arrow.scale
    di[i, ] <- 0
    dir <- Matrix::colSums(di * tp[, i])
    dic <- Matrix::colSums(di * (tp[, i] > 0)/sum(tp[, i] >
                                                    0))
    dia <- dir - dic
    suppressWarnings(arrows(emb[colnames(em)[i], 1], emb[colnames(em)[i],
                                                         2], emb[colnames(em)[i], 1] + dic[1], emb[colnames(em)[i],
                                                                                                   2] + dic[2], length = 0.05, lwd = 1, col = "blue"))
    suppressWarnings(arrows(emb[colnames(em)[i], 1], emb[colnames(em)[i],
                                                         2], emb[colnames(em)[i], 1] + dir[1], emb[colnames(em)[i],
                                                                                                   2] + dir[2], length = 0.05, lwd = 1, col = "red"))
    suppressWarnings(arrows(emb[colnames(em)[i], 1] + dic[1],
                            emb[colnames(em)[i], 2] + dic[2], emb[colnames(em)[i],
                                                                  1] + dir[1], emb[colnames(em)[i], 2] + dir[2],
                            length = 0.05, lwd = 1, lty = 1, col = "grey50"))
    suppressWarnings(arrows(emb[colnames(em)[i], 1], emb[colnames(em)[i],
                                                         2], emb[colnames(em)[i], 1] + dia[1], emb[colnames(em)[i],
                                                                                                   2] + dia[2], length = 0.05, lwd = 1, col = "black"))
  }
  else {
    cat("calculating arrows ... ")
    arsd <- data.frame(t(velocyto.R:::embArrows(emb, tp, arrow.scale,
                                   n.cores)))
    rownames(arsd) <- rownames(emb)
    if (expression.scaling) {
      tpb <- tp > 0
      tpb <- t(t(tpb)/colSums(tpb))
      es <- as.matrix(em %*% tp) - as.matrix(em %*% as.matrix(tpb))
      pl <- pmin(1, pmax(0, apply(as.matrix(vel$deltaE[,
                                                       colnames(es)]) * es, 2, sum)/sqrt(colSums(es *
                                                                                                   es))))
      arsd <- arsd * pl
    }
    ars <- data.frame(cbind(emb, emb + arsd))
    colnames(ars) <- c("x0", "y0", "x1", "y1")
    colnames(arsd) <- c("xd", "yd")
    rownames(ars) <- rownames(emb)
    ars$col <- celcol
    cat("done\n")
    if (show.grid.flow) {
      cat("grid estimates ... ")
      rx <- range(c(range(ars$x0), range(ars$x1)))
      ry <- range(c(range(ars$y0), range(ars$y1)))
      gx <- seq(rx[1], rx[2], length.out = grid.n)
      gy <- seq(ry[1], ry[2], length.out = grid.n)
      if (is.null(grid.sd)) {
        grid.sd <- sqrt((gx[2] - gx[1])^2 + (gy[2] -
                                               gy[1])^2)/2
        cat("grid.sd=", grid.sd, " ")
      }
      if (is.null(min.arrow.size)) {
        min.arrow.size <- sqrt((gx[2] - gx[1])^2 + (gy[2] -
                                                      gy[1])^2) * 0.01
        cat("min.arrow.size=", min.arrow.size, " ")
      }
      if (is.null(max.grid.arrow.length)) {
        max.grid.arrow.length <- sqrt(sum((par("pin")/c(length(gx),
                                                        length(gy)))^2)) * 0.25
        cat("max.grid.arrow.length=", max.grid.arrow.length,
            " ")
      }
      garrows <- do.call(rbind, lapply(gx, function(x) {
        cd <- sqrt(outer(emb[, 2], -gy, "+")^2 + (x -
                                                    emb[, 1])^2)
        cw <- dnorm(cd, sd = grid.sd)
        gw <- Matrix::colSums(cw)
        cws <- pmax(1, Matrix::colSums(cw))
        gxd <- Matrix::colSums(cw * arsd$xd)/cws
        gyd <- Matrix::colSums(cw * arsd$yd)/cws
        al <- sqrt(gxd^2 + gyd^2)
        vg <- gw >= min.grid.cell.mass & al >= min.arrow.size
        cbind(rep(x, sum(vg)), gy[vg], x + gxd[vg], gy[vg] +
                gyd[vg])
      }))
      colnames(garrows) <- c("x0", "y0", "x1", "y1")
      if (fixed.arrow.length) {
        suppressWarnings(arrows(garrows[, 1], garrows[,
                                                      2], garrows[, 3], garrows[, 4], length = 0.05,
                                lwd = arrow.lwd))
      }
      else {
        alen <- pmin(max.grid.arrow.length, sqrt(((garrows[,
                                                           3] - garrows[, 1]) * par("pin")[1]/diff(par("usr")[c(1,
                                                                                                                2)]))^2 + ((garrows[, 4] - garrows[, 2]) *
                                                                                                                             par("pin")[2]/diff(par("usr")[c(3, 4)]))^2))
        suppressWarnings(lapply(1:nrow(garrows), function(i) arrows(garrows[i,
                                                                            1], garrows[i, 2], garrows[i, 3], garrows[i,
                                                                                                                      4], length = alen[i], lwd = arrow.lwd, col=celcol[i])))
      }
      if (plot.grid.points)
        points(rep(gx, each = length(gy)), rep(gy, length(gx)),
               pch = ".", cex = 0.1, col = ac(1, alpha = 0.4))
      cat("done\n")
      if (return.details) {
        cat("expression shifts .")
        scale.int <- switch(scale, log = 2, sqrt = 3,
                            1)
        if (!expression.scaling) {
          tpb <- tp > 0
          tpb <- t(t(tpb)/colSums(tpb))
          es <- as.matrix(em %*% tp) - as.matrix(em %*%
                                                   as.matrix(tpb))
        }
        cat(".")
        gs <- do.call(cbind, parallel::mclapply(gx, function(x) {
          cd <- sqrt(outer(emb[, 2], -gy, "+")^2 + (x -
                                                      emb[, 1])^2)
          cw <- dnorm(cd, sd = grid.sd)
          gw <- Matrix::colSums(cw)
          cws <- pmax(1, Matrix::colSums(cw))
          cw <- t(t(cw)/cws)
          gxd <- Matrix::colSums(cw * arsd$xd)
          gyd <- Matrix::colSums(cw * arsd$yd)
          al <- sqrt(gxd^2 + gyd^2)
          vg <- gw >= min.grid.cell.mass & al >= min.arrow.size
          if (any(vg)) {
            z <- es %*% cw[, vg]
          }
          else {
            NULL
          }
        }, mc.cores = n.cores, mc.preschedule = T))
        if (scale == "log") {
          nd <- (log10(abs(nd) + 1) * sign(nd))
        }
        else if (scale == "sqrt") {
          nd <- (sqrt(abs(nd)) * sign(nd))
        }
        cat(".")
        gv <- do.call(cbind, parallel::mclapply(gx, function(x) {
          cd <- sqrt(outer(emb[, 2], -gy, "+")^2 + (x -
                                                      emb[, 1])^2)
          cw <- dnorm(cd, sd = grid.sd)
          gw <- Matrix::colSums(cw)
          cws <- pmax(1, Matrix::colSums(cw))
          cw <- t(t(cw)/cws)
          gxd <- Matrix::colSums(cw * arsd$xd)
          gyd <- Matrix::colSums(cw * arsd$yd)
          al <- sqrt(gxd^2 + gyd^2)
          vg <- gw >= min.grid.cell.mass & al >= min.arrow.size
          if (any(vg)) {
            z <- nd %*% cw[, vg]
          }
          else {
            NULL
          }
        }, mc.cores = n.cores, mc.preschedule = T))
        cat(". done\n")
        return(invisible(list(tp = tp, cc = cc, garrows = garrows,
                              arrows = as.matrix(ars), vel = nd, eshifts = es,
                              gvel = gv, geshifts = gs, scale = scale)))
      }
    }
    else {
      apply(ars, 1,  function(x) {
        #print(x)
        foocol = ac(x[5], alpha = arrow.alpha)
        ## unclear why this is needed frankly
        x <- as.numeric(x[1:4])
        #print(x)

        if (fixed.arrow.length) {
          suppressWarnings(arrows(x[1], x[2], x[3], x[4],
                                  length = 0.05, lwd = arrow.lwd, col=foocol))
        }
        else {
          ali <- sqrt(((x[3] - x[1]) * par("pin")[1]/diff(par("usr")[c(1,
                                                                       2)]))^2 + ((x[4] - x[2]) * par("pin")[2]/diff(par("usr")[c(3,
                                                                                                                                  4)]))^2)
          suppressWarnings(arrows(x[1], x[2], x[3], x[4],
                                  length = min(0.05, ali), lwd = arrow.lwd, col=foocol))
        }
      })
    }
  }
  return(invisible(list(tp = tp, cc = cc)))
}

animation::saveGIF(
  expr = {
    sapply(seq(0.1, 1, 0.1), function(i) {
      show.velocity.on.embedding.cor2(scale(emb.veloviz), vel,
                                      n = 50,
                                      scale='sqrt', fixed.arrow.length=TRUE,
                                      cex=0, arrow.scale=i, show.grid.flow=FALSE,
                                      arrow.lwd=2, arrow.alpha = 0.5, do.par = FALSE,
                                      cell.colors=cell.cols, main='VeloViz', axes=FALSE)
    })
  },
  movie.name = "veloarrows.gif"
)

animation::saveGIF(
  expr = {
    sapply(seq(0.1, 1, 0.1), function(i) {
      show.velocity.on.embedding.cor2(scale(emb.umap), vel,
                                      n = 50,
                                      scale='sqrt', fixed.arrow.length=TRUE,
                                      cex=0, arrow.scale=i, show.grid.flow=FALSE,
                                      arrow.lwd=2, arrow.alpha = 0.5, do.par = FALSE,
                                      cell.colors=cell.cols, main='UMAP', axes=FALSE)
    })
  },
  movie.name = "umaparrows.gif"
)


Recent Posts
- Analyzing ICE Detention Data from 2021 to 2025 on 10 July 2025
- Multi-sample Integrative Analysis of Spatial Transcriptomics Data using Sketching and Harmony in Seurat on 22 April 2025
- Using AI to find heterogeneous scientific speakers on 04 November 2024
- The many ways to calculate Moran's I for identifying spatially variable genes in spatial transcriptomics data on 29 August 2024
- Characterizing spatial heterogeneity using spatial bootstrapping with SEraster on 23 July 2024
Related Posts
- Exploring UMAP parameters in visualizing single-cell spatially resolved transcriptomics data
- A tale of two cell populations: integrating RNA velocity information in single cell transcriptomic data visualization with VeloViz
- Story-telling with Data Visualization
- Complementing single-cell clustering analysis with MERINGUE spatial analysis